April 2024 - This site, and Kamaelia are being updated. There is significant work needed, and PRs are welcome.
Axon Visualiser
Looking inside running systems
In Tools in the Kamaelia distribution, we have the Axon Visualiser. This allows you to look inside running Kamaelia based systems and see what your system is currently doing, what components are active and linked to what.
Starting the Axon Visualiser
The Axon visualiser can be found in the Tools directory of the Kamaelia distribution, named AxonVisualiser.py. In the following run through, we'll use bold italic to indicate something the user types.
Start the Axon Visualiser:
If all goes well, an empty visualiser window will appear (empty except for a logo).
Press ESCAPE or Q to quit.
You can see the full command line options for this tool:
Simple Navel gazing
But that isn't very interesting. Let's get the visualiser to navel gaze a little and introspect itself:
Once the display has settled down, things should look a little more interesting. The visualiser is now showing the components it consists of:
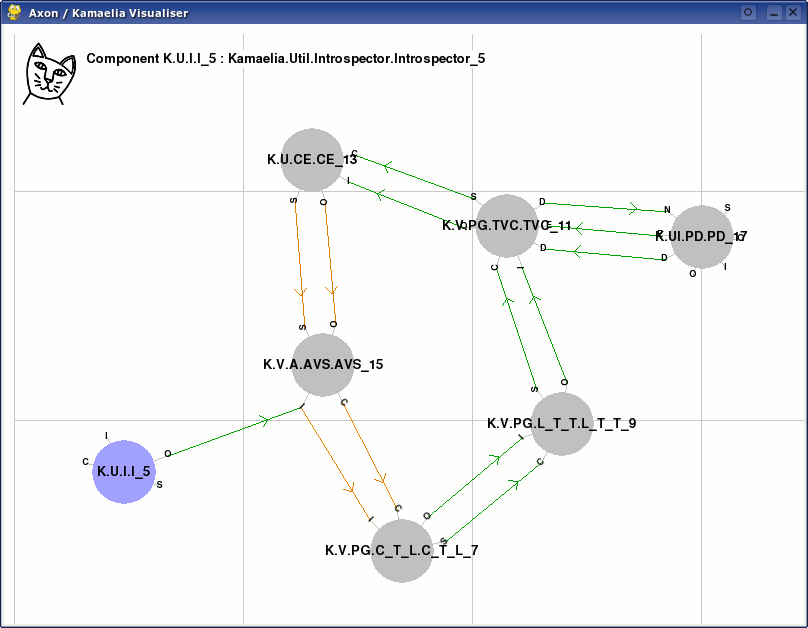
Axon Visualiser Introspecting itself (Click to enlarge)
What am I seeing?
Each grey 'blob' is a component. A component's inboxes and outboxes are labels that hover round the edge of the blob. Linkages between components are the green and orange lines. The direction arrows show the which way data flows. Orange linkages are 'passthrough' linkages - where a component forwards an inbox to a child's inbox or an outbox to a child's outbox.
The name labels for all compoents, inboxes and outboxes are abbreviated.
What you are seeing may not look quite this tidy. But don't worry, you can re-arrange the blobs!
Manipulating the view
Dragcomponents, inboxes or outboxes with the mouse to move them around. As you drag things, the topology visualiser physics model will cause things to move around, trying to rearrange themselves to not get in the way.
Clicka component, inbox or outbox and it will be highlighted. Its full, unabbreviated, name will also be displayed at the top. In the screenshot above, the Introspector component (the source of this introspection data) is highlighted.
Use the arrow keys to pan the view left, right, up and down.
Introspecting Another Program
The Axon Visualiser, by default, receives introspection data from a TCP socket. Lets plug introspection code into another system and watch what is going on.
Adding Introspection
Take the SimpleStreamer.py example. The code added to provide introspection is highlighted in green:
This example can be found in Kamaelia/Examples/example3/SimpleStreamer.py
import Axon as _Axon
import Kamaelia.ReadFileAdaptor
from Kamaelia.SimpleServerComponent import SimpleServer
file_to_stream = "/usr/share/wesnoth/music/wesnoth-1.ogg"
def AdHocFileProtocolHandler(filename):
class klass(Kamaelia.ReadFileAdaptor.ReadFileAdaptor):
def __init__(self,*argv,**argd):
return klass
clientServerTestPort=1500
from Kamaelia.Util.PipelineComponent import pipeline
from Kamaelia.Internet.TCPClient import TCPClient
from Kamaelia.Util.Introspector import Introspector
pipeline( Introspector(), TCPClient("127.0.0.1",1501) ).activate()
SimpleServer(protocol=AdHocFileProtocolHandler(file_to_stream),
As you can see, all you need to do is create an Introspector, and TCPClient (to send the data) and pipeline them together.
By default the Axon Visualiser expects the client to connect on port 1500, however this example program already uses that port. We therefore arbitrarily choose port 1501 instead.
Performing the Introspection
We must start the Axon Visualiser before the system we are introspecting. Why? Because the Introspector component only sends the changes it sees in the system it is introspecting and the TCPClient component will want to connect to the visualiser immediately. If we were to start up the streaming server first, then the visualiser would not be in sync with the data and the TCPClient would have given up trying to connect to it.
Lets start the visualiser, remembering to ask it to listen on port 1501, rather than its default of port 1500:
Now we can start the streaming system:
After a brief pause, the visualiser will gradually be populated with the components, postboxes and linkages currently in SimpleServer. Once it has settled down and you have moved things around to tidy it up, you should see something like this:

A view inside SimpleStreamer.py (Click to enlarge)
What am I seeing?
Why are there so many components, when the SimpleStreamer surely only consists of a few? The simple answer is that you're not only seeing the SimpleServer components, but also the ones you added to perform the introspection.
Introspector (5) is the source of introspection data. Pipeline (5) joins it to TCPClient (7) which is using ConnectedSocketAdapter (17) to send the data to the visualiser.
The highlighted Selector component represents the unix 'select' statement, waiting for events on all socket bindings. Notice that both the introspection 'system' and the server share the Selector. Obviously, the moral of the story is that you can't observe a system without modifying and affecting it.
Watching a changing system
Lets see what happens when a client connects to our streaming server.
First, check that the client (SimpleStreamingClient.py) is going to connect to the machine we're running SimpleStreamer.py on:
from Kamaelia.Internet.TCPClient import TCPClient
from Kamaelia.vorbisDecodeComponent import VorbisDecode, AOAudioPlaybackAdaptor
from Kamaelia.Util.PipelineComponent import pipeline
clientServerTestPort=1500
pipeline(TCPClient("127.0.0.1",clientServerTestPort),
).run()
Now lets run the client...
...and see what happens:
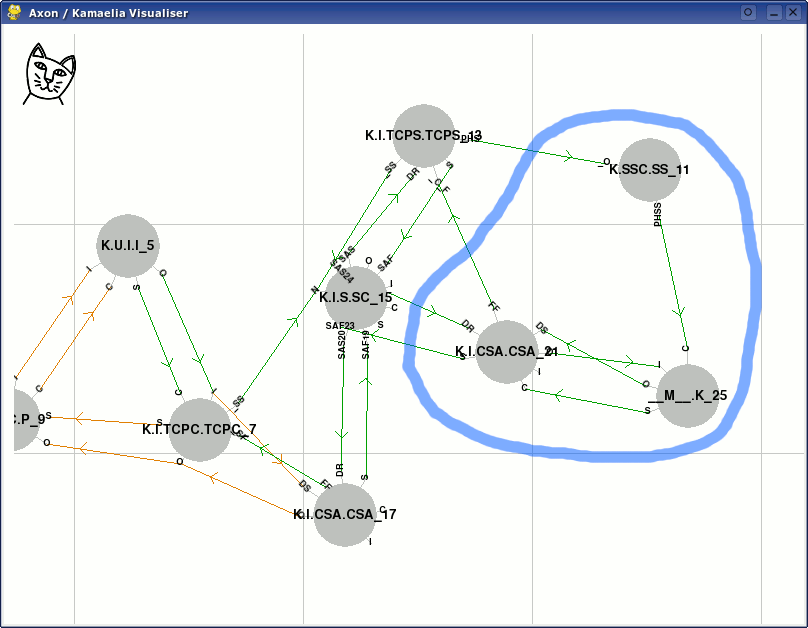
A view inside SimpleStreamer.py when a client has connected (Click to enlarge)
For the duration of the streaming connection, you can see new components, postboxes and linkages created (circled in blue in the above screenshot).
Limitations
You may find that the components appear and disappear too quickly for you to be able to see what is happening. This is because you are remotely viewing what is happening in a live running system, rather than stepping through execution in a debugger. It takes time for data to flow from introspector to visualiser; and it takes time for the visualiser's physics model to sort out the visual mess into a semblance of order.
Also bear in mind that the visualiser will batch process data from the introspector if it comes in particularly fast, redrawing the view less frequently. You may have noticed this when you first started up the streaming server. Consequently, if a change to the system has a very short duration, you may not see it at all.
If you want to freeze the state of a system to inspect it properly, you must cut off the flow of introspection data to the visualiser - either by in some may pausing your program, or by simply killing it (pressing ctrl-c in unix systems).
Visualisation as a debugging aid
We've found this tool to be useful as a debugging aid. We've spotted the following when introspecting running systems:
The Linkages are all wrong!
Introspection lets you see whether the linkages you think you coded have actually been made. You can also follow the arrows to check that the data-flow of your system makes sense.
Components left dangling
A component has finished doing its task and should have been unwired (linkages removed) and/or disappeared.
- Linkages are 'owned' by the component you called the link() method on. Only that component's postman can destroy that linkage. Check that all components that created the linkages are destroying them ... correctly.
- A component will remain 'active' (and be called by the scheduler) until it exits its main() generator. Check that the component is shutting down properly.
One outbox linked to multiple inboxes
Axon only supports many-to-one or one-to-one linkages. One-to-many are not supported.
- If one outbox is linked to many inboxes, only one will receive any data sent. Which one receives the data is undefined.
Non-sensical introspection visualisation / far too many components
If a component's microprocess is activated more than once, the scheduler will register it multiple times. The Introspector cannot guarantee being able to make sense of such situations!
- Check that you are not, for example, activating a component, then placing it in a pipeline and activating that too.
How it works
This is a specialisation of the Topology Visualiser for viewing the components, and linkages between them, in a running system. This is a quick tutorial to give you an understanding of how to use this tool and what you can do with it.
The actual introspection into a running system is performed separately - by the Introspector component. The visualiser waits to receive this data over a TCP socket connection.
Further information
You can obtain help on the full command line options for the Axon Visualiser:
The Axon visualiser is a specialisation of the generic Topology visualiser system. Set it to navelgaze or 'loop back' to understand what components it is built from:
or:
Summary
This page has shown how to use the Axon Visualiser program and how to add introspection code to a Kamaelia system. You should also have a flavour of how this can be used to aid understanding the runtime properties of your system and to aid debugging.